Monitoring and analyzing
the usage and performance of your server infrastructure and systems
InSights.Services, powered by accelapps, deliver detailed online reports, dashboards, indicators and proactive alerts on detected issues.
Everything is updated in seconds or minutes.

A robust, cloud-based, highly secure monitoring solution using the Microsoft Azure suite of online services
Decision support information for business managers and technical administrators,
supported by the accelapps team.
or call us:
+420 234 715 878
Solution goal
Comprehensive overview of the run, condition and usage of key company servers and systems.
We provide senior executives and technical specialists with information that reveals the actual utilization and running condition of their server systems and services in relation to their business needs and goals, as well as recommended technical policies and practices.
What systems can be monitored?
Windows Server
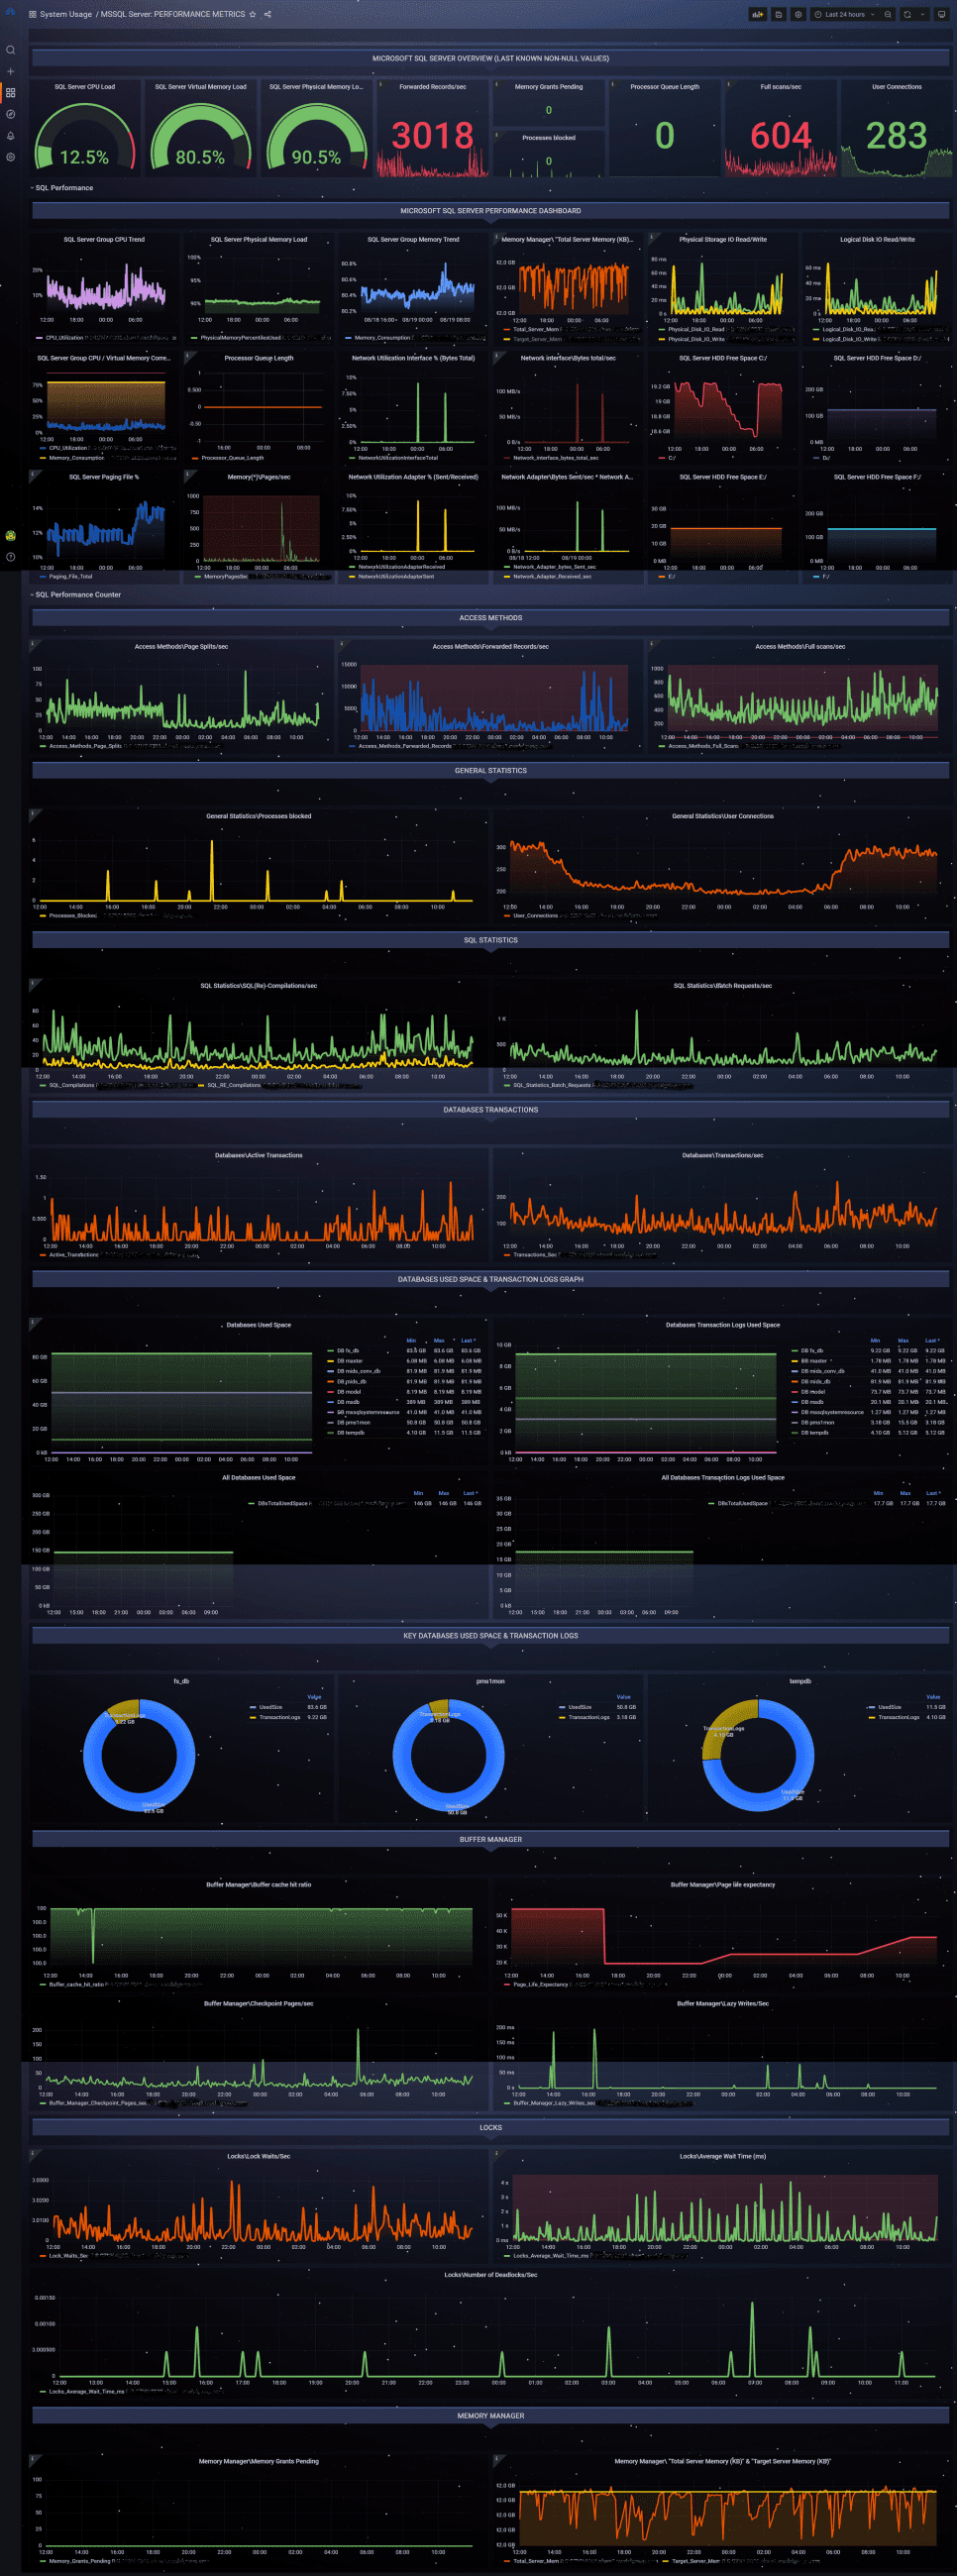
SQL Server
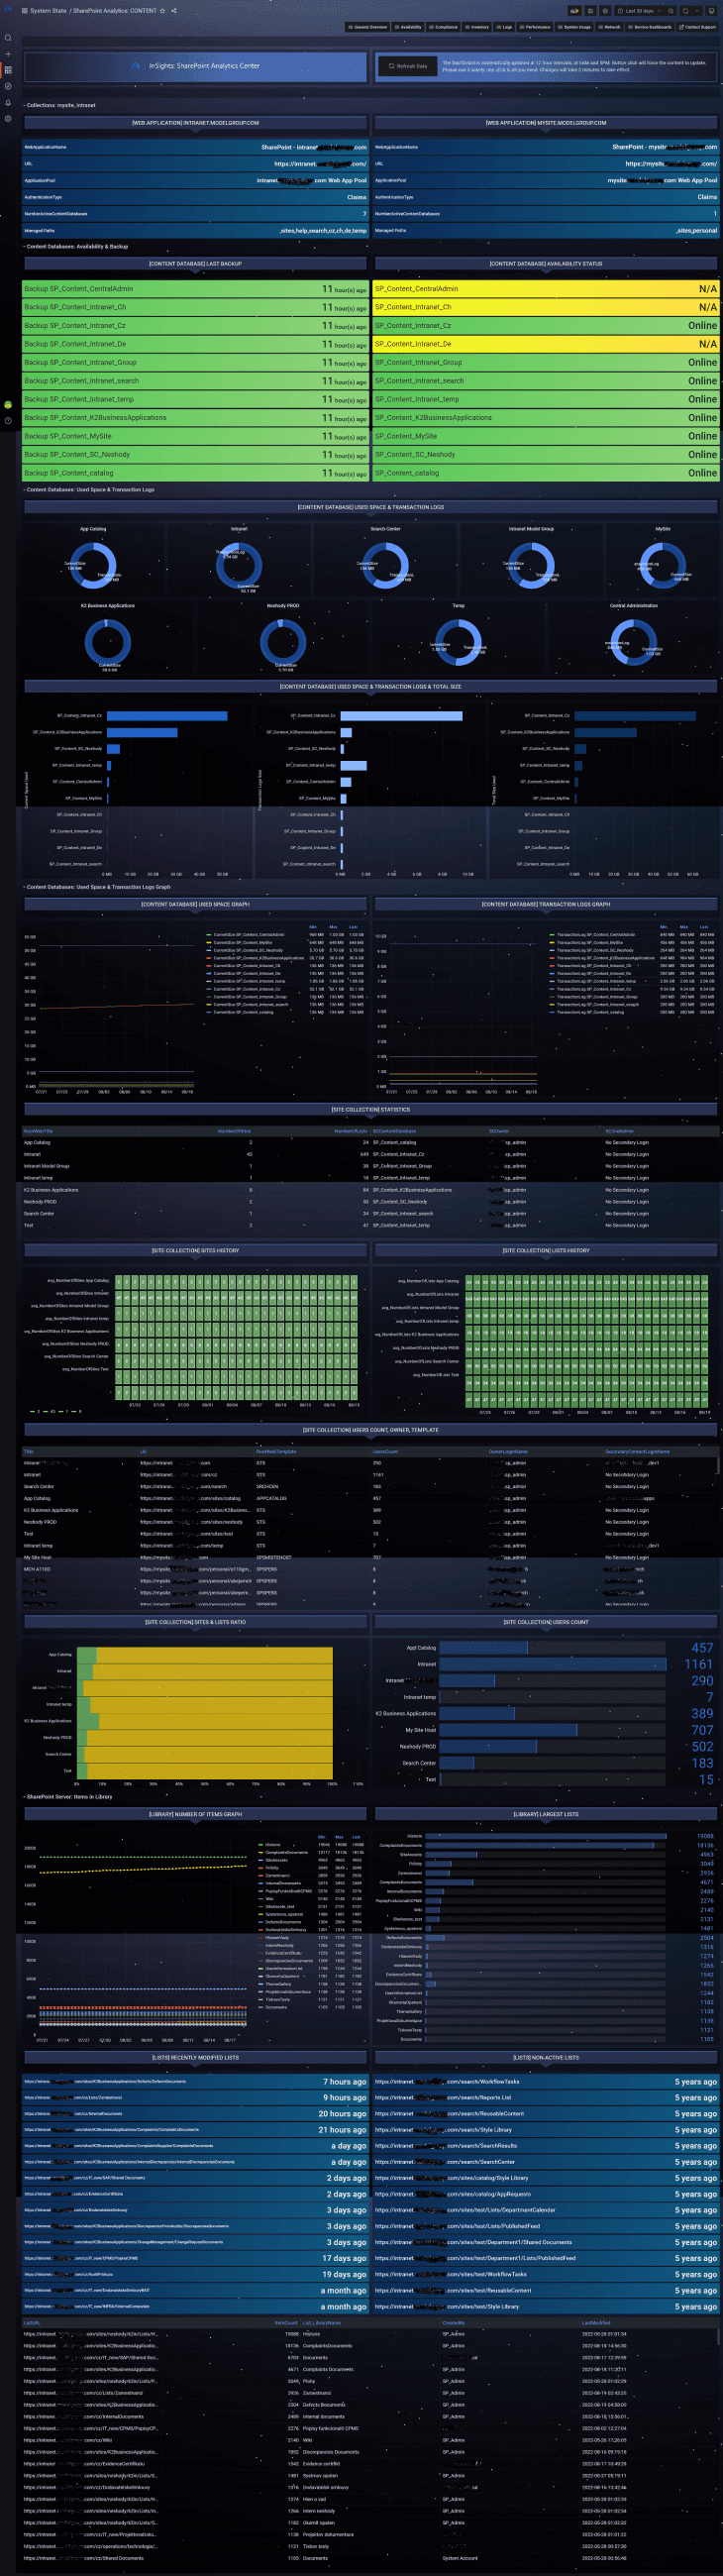
SharePoint Server
K2 Five systems
Microsoft365
The specific server role does not matter. We support everything from file servers, database or application servers, web servers, etc.
Compliance infrastructure
How to effectively look at the state of infrastructure? It is certainly necessary to continuously monitor basic indicators such as memory, processor and service utilization on individual servers. However, does this data give us insight into whether the server in question and its condition is evaluating the role it plays? Obviously not.
InSights.Services doesn't just look at servers in terms of resource utilization, running services or messages in log files.
We assign roles to servers, define a set of attributes that the roles must meet, and use this complex data to determine whether the server, its settings, running and load meet the requirements and is therefore "In Compliance".
In addition, we assign roles to the users who evaluate the data. Users in the CIO, CTO or CFO roles can therefore see different dashboards, the ones that are relevant to them.

Monitored areas
We understand we need to present it in a smart way, depending on the person who reads and evaluates the data and the role that the monitored systems play. So we work with pre-prepared views reflecting the positions you hold within the organization and the roles the servers fulfill.
Availability
Monitoring frequency: Continuous
Availability and status of services and entire systems monitoring, with a detailed overview of change history, information about the last change, an overview of service and server restarts, with the ability to define time filters.
Compliance
Monitoring frequency: 30 - 180 seconds
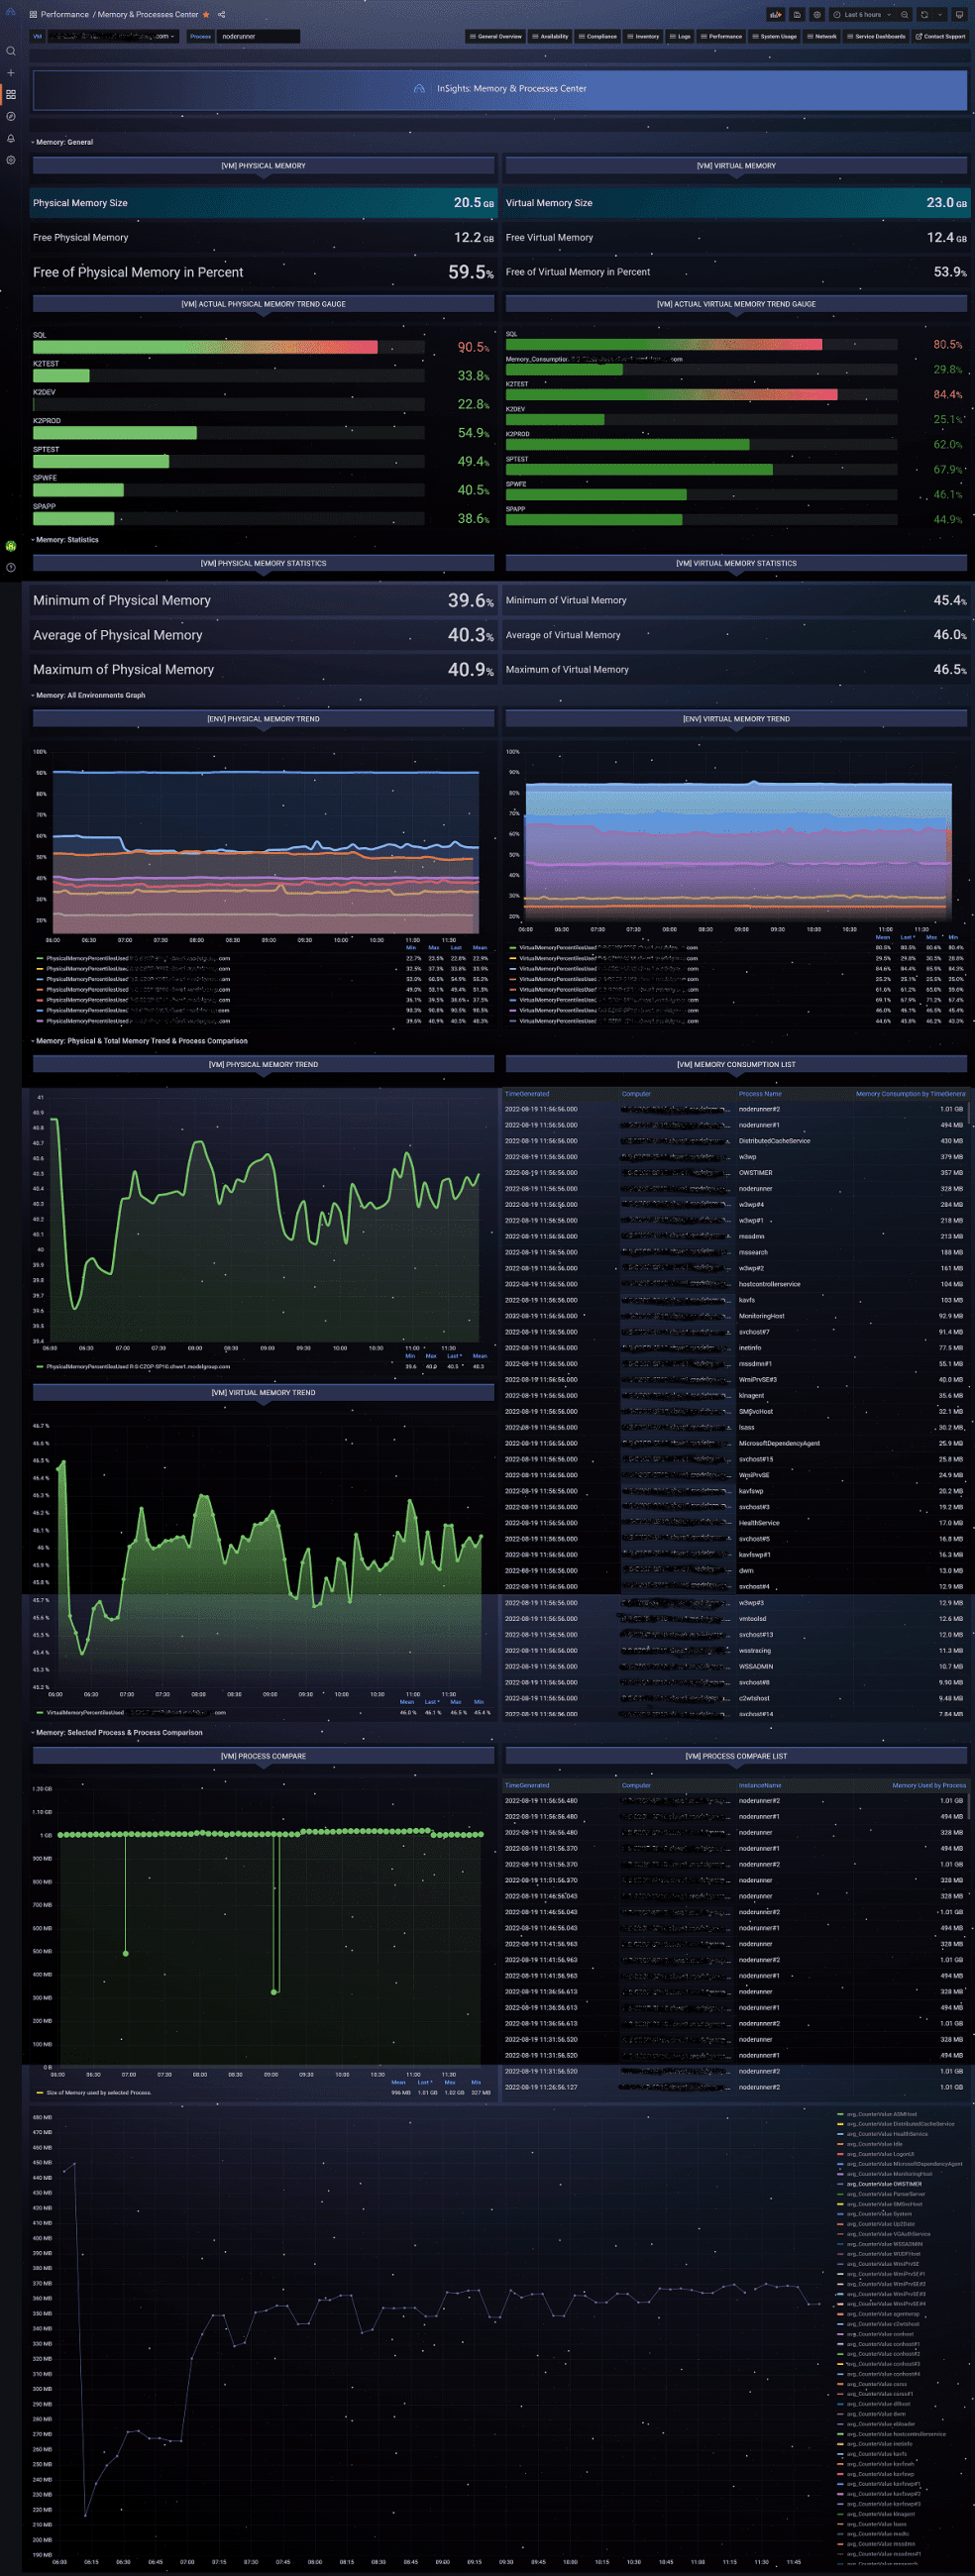
Performance
Monitoring frequency: 10 - 300 seconds
CPU usage and running processes monitoring, memory, disks, and network interfaces. Plus, with whatever performance counters you require, typically based on the type and role of the system.
Log entries
Monitoring frequency: Continuous
Absolute overview of log file records and their details, both Windows application and system logs and any other logs, e.g. IIS, SQL, SharePoint, K2, etc.
Changes
Monitoring frequency: 30 seconds
Specialized dashboards
Monitoring frequency:
Continuous, by data type
Custom data
Monitoring frequency:
Continuous, by data type
It is no exaggeration to say that we can collect and evaluate de-facto any data that can be monitored from monitored systems.
> 350 information panels
Forget about sensors and aspects.
At InSights, we work with the concept of panels. The panels display specific information, either textual, e.g. info about the status of the monitored service, or graphical, e.g. about the evolution of the system workload.
Dedicated tenant
Custom InSights tenant for each client, web access.
35 dashboards
We group panels into pages,
dashboards, which present them
in a logical whole.
Information can be searched and displayed for the past time period.
Online, 24x7
Available on PC, mobile, tablet, anywhere with a web browser, anytime.
30 - 720 day data retention
We store the performance counters data
for 30 days. This limit can be increased
up to 720 days.
Selected data for SharePoint and K2 dashboards is retained for up to
720 days.
Secured
Secured access, secured data storage.
InSights Dashboards Examples